|
Continued from
FrontPage of Article
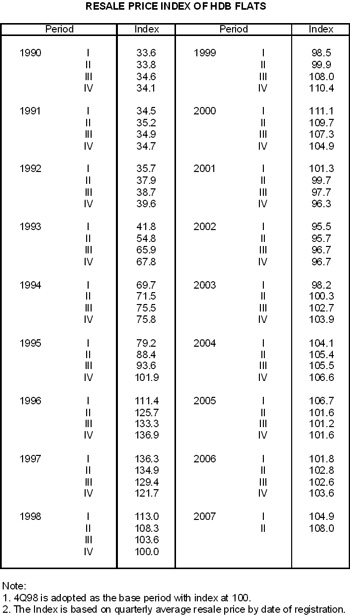
ANNEX A
Table A1: HDB’s Resale Price Index,
1Q90-2Q07
ANNEX B
Table B1: Median Resale Prices by
Town and Flat Type,for Resale Cases Registered in 2nd Quarter 2007
|
ANG MO KIO |
-
|
$137,000*
|
$172,000
|
$260,000
|
$372,000
|
$475,000*
|
|
BEDOK |
-
|
$123,500*
|
$172,000
|
$224,500
|
$332,000
|
$420,000
|
|
BISHAN |
-
|
-
|
$205,000
|
$311,500
|
$400,000
|
$475,000
|
|
BUKIT BATOK |
-
|
-
|
$160,000
|
$234,000
|
$358,800
|
$370,800
|
|
BUKIT MERAH |
$115,000*
|
$133,000*
|
$200,000
|
$371,000
|
$474,000
|
-
|
|
BUKIT PANJANG |
-
|
-
|
$155,500
|
$220,500
|
$280,000
|
$344,000
|
|
BUKIT TIMAH |
-
|
-
|
$250,000*
|
$312,000*
|
$408,000*
|
$486,500*
|
|
CENTRAL |
-
|
$139,500*
|
$246,500
|
$341,000*
|
$436,000*
|
-
|
|
CHOA CHU KANG |
-
|
-
|
$150,500*
|
$232,000
|
$283,800
|
$349,000
|
|
CLEMENTI |
-
|
-
|
$185,000
|
$302,200
|
$450,000*
|
$500,000*
|
|
GEYLANG |
-
|
$123,000*
|
$162,500
|
$265,000
|
$386,000
|
$380,000*
|
|
HOUGANG |
-
|
-
|
$166,500
|
$235,000
|
$314,000
|
$361,500
|
|
JURONG EAST |
-
|
-
|
$168,000
|
$237,000
|
$298,500
|
$408,000
|
|
JURONG WEST |
-
|
-
|
$151,500
|
$223,000
|
$290,000
|
$312,000
|
|
KALLANG/WHAMPOA |
-
|
$136,500*
|
$173,000
|
$295,000
|
$417,500
|
$460,000*
|
|
MARINE PARADE |
-
|
-
|
$240,000
|
$340,000*
|
$485,000*
|
-
|
|
PASIR RIS/CHANGI |
-
|
-
|
$153,000*
|
$245,000
|
$293,300
|
$362,000
|
|
PUNGGOL |
-
|
-
|
-
|
$252,500
|
$307,000
|
$365,000*
|
|
QUEENSTOWN |
-
|
$130,000*
|
$186,500
|
$388,000
|
$500,000
|
$609,000*
|
|
SEMBAWANG |
-
|
-
|
-
|
$240,000
|
$287,000
|
$334,000
|
|
SENGKANG |
-
|
-
|
-
|
$245,000
|
$300,000
|
$339,500
|
|
SERANGOON |
-
|
$121,000*
|
$169,000
|
$242,000
|
$312,500
|
$389,000
|
|
TAMPINES |
-
|
-
|
$192,000
|
$263,000
|
$310,000
|
$399,000
|
|
TOA PAYOH |
-
|
$136,000*
|
$195,000
|
$337,500
|
$440,000
|
$445,000*
|
|
WOODLANDS |
-
|
$110,000*
|
$152,500
|
$225,500
|
$278,000
|
$350,000
|
|
YISHUN |
-
|
-
|
$159,000
|
$200,000
|
$273,800
|
$331,500
|
|
OVERALL |
$115,000
|
$132,000
|
$171,000
|
$241,000
|
$300,000
|
$358,000
|
Notes:
1) (-) indicates no
resale transactions in the quarter.
2) Figures in asterisks
refer to cases where there are less than 20 resale transactions in
the quarter for the particular town and flat type. As such, they may
not be representative.
3) The data above
excluded transactions that may not accurately reflect the market
price; i.e. resale of part shares, resale between related parties,
cases under the Conversion Scheme, resale of terrace flats,
converted flats and HUDC flats.
4) The figures are
rounded to the nearest hundred dollars.
Annex C
Table C1: Median
Cash-Over-Valuation (COV) by Town and Flat Type, for Resale Cases
Registered in 2nd Quarter 2007
|
ANG MO KIO |
-
|
$10,000*
|
$5,000
|
$15,000
|
$25,000
|
$30,000*
|
$9,000
|
|
BEDOK |
-
|
$4,400*
|
$7,000
|
$7,000
|
$12,800
|
$28,000
|
$8,000
|
|
BISHAN |
-
|
-
|
$15,000
|
$19,300
|
$28,500
|
$28,800
|
$24,000
|
|
BUKIT BATOK |
-
|
-
|
$5,000
|
$9,000
|
$16,500
|
$12,000
|
$6,900
|
|
BUKIT MERAH |
$20,000*
|
$13,000*
|
$15,900
|
$25,000
|
$40,000
|
-
|
$22,000
|
|
BUKIT PANJANG |
-
|
-
|
$2,000
|
$6,000
|
$0
|
$2,500
|
$3,000
|
|
BUKIT TIMAH |
-
|
-
|
$10,000*
|
$13,000*
|
$60,000*
|
$35,000*
|
$20,000
|
|
CENTRAL |
-
|
$6,500*
|
$18,500
|
$25,000*
|
$26,000*
|
-
|
$19,000
|
|
CHOA CHU KANG |
-
|
-
|
$7,000*
|
$5,000
|
$5,000
|
$6,500
|
$5,000
|
|
CLEMENTI |
-
|
-
|
$7,300
|
$18,200
|
$35,000*
|
$65,000*
|
$11,900
|
|
GEYLANG |
-
|
$9,000*
|
$8,000
|
$15,000
|
$0
|
$0*
|
$8,000
|
|
HOUGANG |
-
|
-
|
$9,000
|
$9,000
|
$15,000
|
$11,000
|
$10,000
|
|
JURONG EAST |
-
|
-
|
$7,000
|
$10,000
|
$10,000
|
$20,000
|
$9,000
|
|
JURONG WEST |
-
|
-
|
$5,000
|
$7,000
|
$6,000
|
$0
|
$5,000
|
|
KALLANG/WHAMPOA |
-
|
$16,800*
|
$8,000
|
$22,500
|
$36,500
|
$42,000*
|
$13,000
|
|
MARINE PARADE |
-
|
-
|
$20,500
|
$36,500*
|
$40,000*
|
-
|
$29,900
|
|
PASIR RIS/CHANGI |
-
|
-
|
$4,000*
|
$5,000
|
$6,000
|
$10,000
|
$6,500
|
|
PUNGGOL |
-
|
-
|
-
|
$3,000
|
$5,000
|
$7,000*
|
$5,000
|
|
QUEENSTOWN |
-
|
$10,000*
|
$14,000
|
$35,500
|
$42,000
|
$41,500*
|
$16,000
|
|
SEMBAWANG |
-
|
-
|
-
|
$8,000
|
$6,000
|
$0
|
$7,000
|
|
SENGKANG |
-
|
-
|
-
|
$6,000
|
$5,000
|
$0
|
$5,000
|
|
SERANGOON |
-
|
$13,000*
|
$9,000
|
$12,000
|
$11,500
|
$10,000
|
$10,000
|
|
TAMPINES |
-
|
-
|
$7,000
|
$8,000
|
$10,000
|
$15,400
|
$9,000
|
|
TOA PAYOH |
-
|
$10,000*
|
$13,000
|
$22,000
|
$34,500
|
$31,000*
|
$17,000
|
|
WOODLANDS |
-
|
$15,000*
|
$3,000
|
$4,000
|
$0
|
$0
|
$2,000
|
|
YISHUN |
-
|
-
|
$5,500
|
$5,000
|
$2,000
|
$1,400
|
$5,000
|
|
OVERALL
|
$20,000
|
$10,000
|
$7,000
|
$8,000
|
$7,000
|
$6,300
|
$7,000
|
Notes:
1) (-) indicates no
resale transactions in the quarter.
2) Figures in asterisks
refer to cases where there are less than 20 resale transactions in
the quarter for the particular town and flat type. As such, they may
not be representative.
3) The data above
excluded transactions that may not accurately reflect the market
price; i.e. resale of part shares, resale between related parties,
cases under the Conversion Scheme, resale of terrace flats,
converted flats and HUDC flats.
4) Cash-Over-Valuation
is the difference between the Resale Price and Market Value of the
flat. The data above excluded transactions where there is no
valuation done for the particular flat.
5) The figures are
rounded to the nearest hundred dollars.
Annex D
Table D1: Number of
Resale Applications Registered by Flat Type
|
3Q06
|
5
|
77
|
2,434
|
2,771
|
1,615
|
519
|
7,421
|
|
4Q06
|
6
|
87
|
2,454
|
2,986
|
1,686
|
624
|
7,843
|
|
1Q07
|
5
|
67
|
1,908
|
2,365
|
1,402
|
511
|
6,258
|
|
2Q07
|
3
|
65
|
2,390
|
3,091
|
2,305
|
854
|
8,708
|
Note: * includes
Multi-Generation flats.
Annex E
Table E1: Median
Subletting Rents by Town and Flat Type,for Sublet Applications
Approved in 2nd Quarter 2007
|
ANG MO KIO |
-
|
$650*
|
$950
|
$1,100
|
$1,300
|
$1,500*
|
|
BEDOK |
-
|
$650*
|
$1,000
|
$1,200
|
$1,330
|
$1,380*
|
|
BISHAN |
-
|
-
|
$950
|
$1,400
|
$1,300
|
$1,300*
|
|
BUKIT BATOK |
-
|
-
|
$930
|
$1,100
|
$1,230
|
$1,400
|
|
BUKIT MERAH |
$460*
|
$700*
|
$1,100
|
$1,400
|
$1,600
|
-
|
|
BUKIT PANJANG |
-
|
-
|
$850*
|
$1,000
|
$1,200
|
$1,100
|
|
BUKIT TIMAH |
-
|
-
|
$1,300*
|
$1,260*
|
$1,050*
|
$1,300*
|
|
CENTRAL |
-
|
$700*
|
$1,300
|
$1,350*
|
-
|
-
|
|
CHOA CHU KANG |
-
|
-
|
$800*
|
$1,100
|
$1,300
|
$1,380
|
|
CLEMENTI |
-
|
-
|
$1,000
|
$1,200
|
$1,580
|
$1,600*
|
|
GEYLANG |
-
|
$700*
|
$900
|
$1,200
|
$1,200
|
$1,500*
|
|
HOUGANG |
-
|
-
|
$900
|
$1,130
|
$1,200
|
$1,300
|
|
JURONG EAST |
-
|
-
|
$830
|
$1,200
|
$1,200
|
$1,580*
|
|
JURONG WEST |
-
|
-
|
$900
|
$1,000
|
$1,200
|
$1,400
|
|
KALLANG/WHAMPOA |
-
|
$850*
|
$1,000
|
$1,200
|
$1,600
|
$1,500*
|
|
MARINE PARADE |
-
|
-
|
$1,150
|
$1,300
|
$1,600*
|
-
|
|
PASIR RIS/CHANGI |
-
|
$800*
|
$700*
|
$1,200
|
$1,250
|
$1,400
|
|
PUNGGOL |
-
|
-
|
-
|
$1,000
|
$1,300
|
$1,200*
|
|
QUEENSTOWN |
-
|
$800
|
$1,100
|
$1,300
|
$1,500
|
$1,900*
|
|
SEMBAWANG |
-
|
-
|
-
|
$1,200
|
$1,200
|
$1,300
|
|
SENGKANG |
-
|
-
|
-
|
$1,200
|
$1,290
|
$1,490
|
|
SERANGOON |
-
|
-
|
$950
|
$1,200
|
$1,300
|
$1,200
|
|
TAMPINES |
-
|
-
|
$1,000
|
$1,130
|
$1,300
|
$1,530
|
|
TOA PAYOH |
-
|
$700*
|
$1,000
|
$1,200
|
$1,500
|
$1,600*
|
|
WOODLANDS |
-
|
-
|
$880
|
$1,000
|
$1,200
|
$1,300
|
|
YISHUN |
-
|
-
|
$950
|
$1,000
|
$1,300
|
$1,200
|
|
OVERALL |
$460
|
$730
|
$980
|
$1,180
|
$1,320
|
$1,410
|
Notes:
1) (-) indicates no subletting transactions in the quarter.
2) Figures in asterisks refer to cases where there are less than 10
subletting transactions in the quarter for the particular town and
flat type. As such, they may not be representative.
3) The data above is based on rents self-declared in the subletting
application forms. Nevertheless, it serves as a useful reference in
sublet flat hunting and basis for rent negotiations.
4) The figures are rounded to the nearest ten dollars.
Annex F
Table F1: Number of Subletting Approvals by Flat Type
|
3Q06
|
3
|
23
|
784
|
658
|
471
|
175
|
2,114
|
|
4Q06
|
1
|
34
|
782
|
673
|
476
|
186
|
2,152
|
|
1Q07
|
1
|
22
|
847
|
735
|
602
|
239
|
2,446
|
|
2Q07
|
5
|
38
|
1,279
|
1,078
|
854
|
338
|
3,592
|
Source:
www.hdb.gov.sg Press Release 27 Jul 2007

|


