|
Continued
In terms of operating receipts, wholesale &
retail trade accounted for the largest share of 78.2 per cent of the
total collected by the services sector (Chart 4). However, due to
its high operating expenditure, the group’s value added of $22.7
billion accounted for a smaller proportion of the services sector.
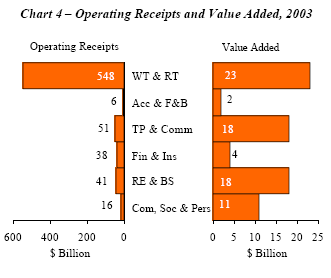
In comparison, both real estate & business
services and transport & communications generated significant value
added shares of 24.1 and 23.8 per cent respectively despite their
relatively smaller operating receipts contributions of 6-7 per cent.
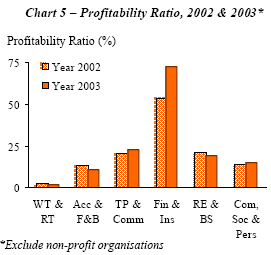
V. KEY PERFORMANCE RATIOS Profitability Ratio
of financial & insurance services remained the highest among the
main services groups at 72.9 per cent in 2003 (Chart 5).
Wholesale & retail trade registered the lowest profitability ratio
of 1.9 per cent in 2003. The ratios of the remaining services groups
ranged from 11-23 per cent.
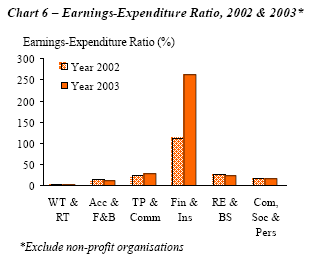
Cost Effectiveness, as measured by the
earnings-expenditure ratio, was also highest for financial &
insurance services (263.3 per cent) in 2003. This implied that the
group’s operating surplus exceeded its operating expenditure. The
high ratio was partly attributed to the considerable high operating
surplus and relatively low operating expenditure registered by
financial & investment holding companies and credit card services
firms. In comparison, the earnings-expenditure ratios of other
services groups were more moderate, ranging from 2.0 per cent for
wholesale & retail trade to 27.0 per cent for transport &
communications (Chart 6).
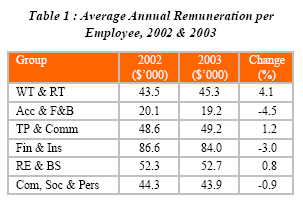
Average Annual Remuneration per Employee was
$84,000 for the financial & insurance services in 2003. Although 3.0
per cent lower than 2002’s remuneration, the amount remained the
highest among the various services groups (Table 1). Employees in
wholesale & retail trade registered the largest year-on-year
increase of 4.1 per cent in average remuneration. Their counterparts
in accommodation and food & beverage services, on the other hand,
experienced a drop of 4.5 per cent in average annual remuneration
compared to 2002.
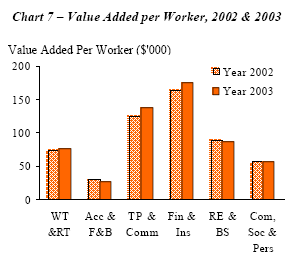
Value Added per Worker for financial & insurance
services was correspondingly the highest at $174,800 in 2003.
Majority of the industry groups registered higher value added per
worker in 2003, except accommodation and food & beverage services
(-10.5 per cent), and real estate & business services (-1.3 per
cent) (Chart 7).
VI. PERFORMANCE BY FIRM SIZE
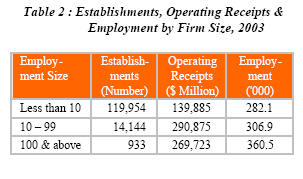
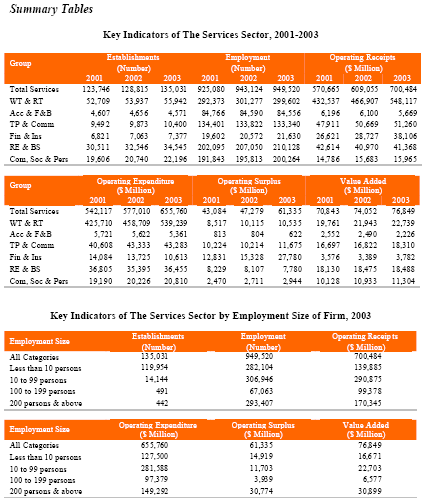
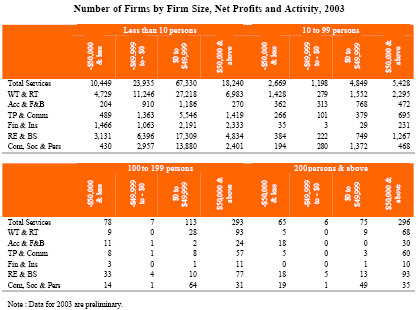
Key Indicators of Firms by Size Small firms
(i.e. less than 10 workers) formed the majority (88.8 per cent) in
the services sector. However, they contributed only 20.0 and 29.7
per cent to total operating receipts and employment respectively
(Table 2). Medium firms (10-99 workers), which made
up 10.5 per cent of the sector, accounted for the largest share of
operating receipts (41.5 per cent). Although comprising only 0.7 per
cent of the total number of firms in the sector, large firms (100
workers & more) were the biggest employer, engaging 38.0 per cent of
all workers.
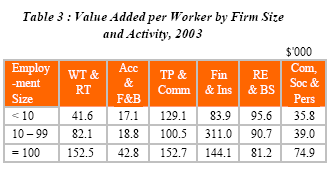
Value Added per Worker of small firms was lower
than that of medium and large firms across all services groups, with
the exception of transport & communications and real estate &
business services. Among the services groups, transport &
communications’ value added per worker was the highest for small and
large firms. Financial & insurance services took the top spot for
medium firms. Accommodation and food & beverage services registered
the lowest value added per worker among all services groups for all
firm sizes (Table 3).
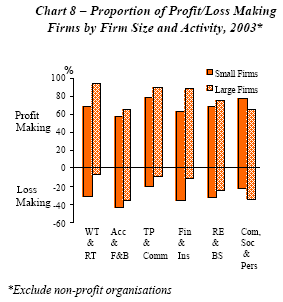
Profitability of Firms by Size
In 2003, the average proportion of small firms which were profitable
was 69.7 per cent. In comparison, the proportion of profitable large
firms was higher at 80.8 per cent. Transport & communications had
the highest proportion (79.0 per cent) of profitmaking small firms
among the services groups (Chart 8). A high proportion (93.4 per
cent) of large firms in wholesale & retail trade were found to be
profitable as compared to the other services groups.
Main Business Costs of Firms by Size
The major business costs for small firms among the various services
groups were different due to the diverse nature of their activities.
Being in the trading business, wholesale & retail trade firms
incurred a significant amount (91.2 per cent) of their operating
expenditure on purchases of goods (Table 4a). Accommodation and food
& beverage services spent almost half of their expenditure on
purchases of food & beverages.
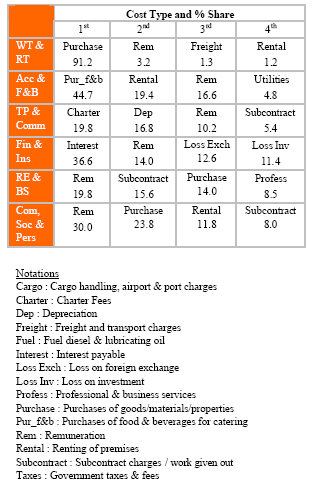
For small firms engaged in financial & insurance
services, the top business cost was interest payable (36.6 per
cent), while the main expense item for transport & communications
firms was charter fees (19.8 per cent).Remuneration
was among the top four cost items for all the services groups.
Remuneration shares ranged from 3.2 per cent for wholesale & retail
trade to 30.0 per cent for community, social & personal services.
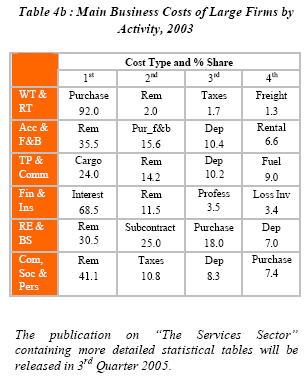
The top four cost items incurred by small and large firms within the
same services groups were different for all (Table 4b). Compared to
small firms, depreciation and taxes were cost items that were more
predominant in large firms due to their larger scale of operations.
Explanatory Note
The services sector report provides an overview of
the performance of industries in the services sector. Industries not
covered in the specific services industry reports in the series are
covered in this consolidated report. The detailed services
activities are presented below:
Wholesale and Retail Trade
Wholesale Trade
Wholesale on a fee or contract basis
Wholesale of agricultural raw materials, live
animals , food, beverages and tobacco
Wholesale of household goods
Wholesale of non-agricultural intermediate products,
waste and scrap
Wholesale of machinery, equipment and supplies
Wholesale of transport equipment
Other wholesale
Retail Trade
Non-specialised retail in stores
Retail sale of food, beverages and tobacco in
specialised stores
Retail sale of transport equipment
Other retail trade of new goods in specialised
stores
Retail sale of second-hand goods in stores
Retail trade not in stores
Accommodation and Food & Beverage Services
Hotels, camping sites and other provision of
short-stay accommodation
Restaurants, bars and canteens
Transport and Communications
Transport via railways
Other land transport
Sea and coastal water transport
Inland water transport
Air transport services
Storage and warehousing
Supporting services to land transport
Supporting services to water transport
Supporting services to air transport
Services allied to transport
Services allied to transport nec1
Post and courier activities
Telecommunications
Financial and Insurance
Monetary intermediation
Other financial intermediation
Import, export and credit insurance
Insurance and pension funding nec
Real Estate and Business Services
Real estate activities with own or leased property
Real estate activities on a fee or contract basis
Renting of transport equipment
Renting of other machinery and equipment
Renting of personal and household goods nec
IT consultancy
IT development
IT services
Maintenance and repair of office, accounting and
computing machinery
Other IT and related services
Research and experimental development on natural
sciences and engineering
Research and experimental development on social
sciences and humanities
Legal, accounting, book-keeping and auditing
activities; Tax consultancy; Market research and public opinion
polling; Business and management consultancy
Architectural, engineering, land surveying and other
technical activities
Advertising activities
Publishing activities
Business activities nec
Community, Social and Personal Services
General education services
Technical, vocational and commercial education
Higher education
Education services nec
Medical activities
Veterinary activities
Social and community activities
Public administration
Sewage and refuse disposal, sanitation and similar
activities
Activities of business, employers and professional
organisations
Activities of trade unions
Activities of other membership organisations
Motion picture, radio, television and other
entertainment activities
Library , archives, museums and other cultural
activities
Sporting and other recreational activities
Repair and servicing (including inspection) of
vehicles
Repair of personal and household goods
Other service activities nec
The data presented in this report were compiled from
the results of the following surveys:
・ Wholesale Trade Survey
・ Retail Trade Survey
・ Hotels & Catering Survey
・ Transport & Communications Survey
・ Financial Services Survey
・ Business Services & Real Estate Survey
・ Community, Social & Personal Services Survey
・ Non-Profit Organisations Survey
The coverage included all establishments and
statutory boards engaged in services activities but excluded
government ministries and departments, foreign missions, political
parties, taxi drivers, independent artistes and other individual
self-employed persons. Financial institutions under the purview of
the Monetary Authority of Singapore (MAS), hence surveyed by MAS,
were also excluded.
The objective of the surveys is to gather
information on services industries in Singapore to enable in-depth
analyses and understanding of the performance, structure and profile
of this sector. The data and analytical findings are used
extensively for the compilation of national accounts, input-output
tables and other related studies. In addition, the results are used
by policy makers, economic planners and academicians, business
community and researchers in their work.
1 Not
elsewhere classified
 Source:
Singapore Department of Statistics
Press Release 16 Aug 2005
 |