��
��
Table 1: Employment (In Thousands)
|
|
Employment Change
(Compared to preceding period) |
Employment Level as at Jun 05 p |
|
2Q 04 |
3Q 04 |
4Q 04 |
1Q 05 |
2Q 05p |
|
Total |
10.9 |
14.1 |
32.7 |
17.8 |
27.7 |
2,252.1 |
|
Manufacturing |
6.4 |
8.5 |
6.3 |
5.5 |
8.9 |
461.6 |
|
Construction |
-2.7 |
-1.7 |
-1.1 |
1.5 |
3.4 |
231.2 |
|
Services |
8.0 |
7.1 |
28.1 |
10.8 |
15.2 |
1,547.2 |
|
Others* |
-0.7 |
0.1 |
-0.6 |
- |
0.2 |
12.1 |
P: Preliminary estimates
-: Negligible
*: Includes agriculture, fishing, quarrying and utilities.
Data may not add up to the total due to rounding.
Data for 1Q 05 have been revised to 17,800 from a previously
reported 16,900.
Table 2: Retrenchment
|
|
2Q 04 |
3Q 04 |
4Q 04 |
1Q 05 |
2Q 05P |
|
Total |
2,055 |
1,967 |
3,207 |
2,168 |
1,900 |
|
Manufacturing |
750 |
767 |
1,380 |
1,255 |
1,200 |
|
Construction |
187 |
58 |
63 |
50 |
- |
|
Services |
1,102 |
1,060 |
1,728 |
863 |
700 |
|
Others* |
16 |
82 |
36 |
0 |
- |
P: Preliminary estimates
-: Negligible
*: Includes agriculture, fishing, quarrying and utilities.
Data on retrenchment pertain to private sector establishments each
with at least 25 employees.
Table 3: Unemployment Rate (Per Cent)
|
|
Jun 04 |
Sep 04 |
Dec 04 |
Mar 05 |
Jun 05p |
|
Seasonally Adjusted |
|
Overall |
3.6
(4.3) |
3.0
(3.6) |
3.0
(3.7) |
3.3
(3.9) |
3.4
(4.1) |
|
Resident |
4.7
(5.0) |
4.0
(3.9) |
4.0
(4.0) |
4.4
(4.4) |
4.5
(4.8) |
|
Non-Seasonally Adjusted |
|
Overall |
4.4
(5.3) |
2.6
(3.1) |
3.2
(3.9) |
2.8
(3.3) |
4.3
(5.1) |
|
Resident |
5.8
(5.9) |
3.4
(3.5) |
4.2
(4.3) |
3.7
(3.7) |
5.6
(5.7) |
P: Preliminary estimates
( ) : Data before change in methodology.
Data for Jun 05 were obtained from the General Household Survey
while those for other periods were from the Labour Force Survey. The
Labour Force Survey was not conducted in Jun 05 in view of the
conduct of the General Household Survey by Department of Statistics
��
Explanatory Notes
Employment
Source
Administrative records. The self-employed component is estimated
from the Labour Force Survey.
Coverage
The
employment data comprises all persons in employment i.e. employees
and the self�Cemployed. However, it excludes males who are serving
their 2-year full-time national service liability in the Singapore
Armed Forces, Police and Civil Defence Forces.
Data
on the number of local employees are compiled from the Central
Provident Fund (CPF) Board��s administrative records of active
contributors defined as local employees who have at least one CPF
contribution paid for him/her. A local employee is any Singaporean
or Permanent Resident of Singapore who is employed by an employer
under a contract of service or other agreement entered into in
Singapore. Every local employee and his/her employer are required to
make monthly contributions to the CPF which is a compulsory savings
scheme to provide workers financial security in old age and helps
meet the needs of healthcare, home-ownership, family protection, and
asset enhancement.
Data
on foreigners working in Singapore are compiled from the stock of
foreigners on valid work passes issued by the Ministry of Manpower.
Foreigners can work in Singapore only if they have valid work passes
issued by the Ministry of Manpower, upon application by their
employers.
The
number of self-employed persons is estimated from the Labour Force
Survey. The self-employed comprises persons aged 15 years and over
who performed some work for profit or family gain, in cash or in
kind.
Concepts and Definitions
Employment change refers to the difference in the employment level
at the end of the reference period compared with the end of the
preceding period.
Uses and Limitations
This
data series allows users to identify individual industries where
employment is growing or stagnating. An analysis of the data over
time also helps in understanding the impact of economic cyclical and
structural changes on the demand for workers. Detailed data are
published in the quarterly Labour Market Report.
The
change in employment over time is the net result of increases and
decreases in employment i.e. net of inflows and outflows of workers.
Users should not mistake an increase in employment as gross job
creation.
Unemployment
Source
Labour Force Survey
(except for Jun 2005 data which were obtained from the General
Household Survey conducted by Department of Statistics as the Labour
Force Survey was not conducted for the period.)
Coverage
The
survey covers private households on the main island of Singapore. It
excludes workers living in construction worksites, dormitories and
workers�� quarters at the workplace and persons commuting from abroad
to work in Singapore. To achieve full coverage of the labour force
in Singapore, data on residents from the survey are combined with
foreign workforce data compiled from work passes issued by the
Ministry of Manpower.
Concepts and Definitions
Unemployed Persons refer to persons aged 15 years and over who were
without work during the survey reference period but were available
for work and were actively looking for a job. They include persons
who were not working but were taking steps to start their own
business or taking up a new job after the reference period.
Unemployment Rate is defined as the percentage of unemployed persons
to the total number of economically active persons (i.e. employed
and unemployed persons) aged 15 years and over.
Uses and Limitations
The
unemployment rate is probably the best-known measure of the labour
market. It measures unutilised labour supply and is useful in the
study of the economic cycle as it is closely related to the
fluctuations in the business cycle.
Unemployment can have frictional, cyclical and structural elements.
As it takes time for job seekers and employers to find a match,
there is always a certain level of frictional unemployment due to
people changing jobs and from new entrants looking for work for the
first time. Unemployment can also be structural e.g. arising from a
mismatch between the job seekers and the job openings available.
With structural unemployment, even if job vacancies and job seekers
coexist in the labour market, they may not be matched over a long
period of time. Finally, unemployment can be cyclical. This occurs
when there is a general decline in demand for manpower as aggregate
demand for goods and services fall in the event of a cyclical
downturn. Unlike structural and frictional unemployment where the
problem is in matching job openings with job seekers, cyclical
unemployment occurs when there are not enough jobs to go around.
Unemployment can vary due to changes in demand or supply of
manpower. It can decline if more people succeed in securing
employment or when the unemployed persons stop to look for a job and
leave the labour force either temporarily (e.g. to take up training)
or permanently (e.g. to retire). Conversely, unemployment may rise
due to increase in labour supply from new entrants or re-entrants to
the labour market. It will also rise if more people quit their jobs
to look for alternative employment or if there is an increase in
layoffs.
Retrenchment
Source
Labour Market Survey
Coverage
The
survey covers private sector establishments each with at least 25
employees.
Concepts and Definitions
Retrenchment refers to the termination of employment of a permanent
employee due to redundancy.
Uses and Limitations
Data
on retrenchment are useful in the analysis of re-structuring or
ailing industries. Detailed data are published in the quarterly
Labour Market Report.
The
number of persons retrenched (flow) should not be confused with
persons unemployed (stock). Not all persons retrenched will be
unemployed as some will be re-employed or decide to leave the
workforce. Similarly, the pool of unemployed persons comes not only
from retrenchments, but also from new entrants to the labour force
such as school leavers and the economically inactive who decide to
re-join the workforce.
Annex 1
REVISION TO UNEMPLOYMENT DATA
1 The Manpower Research and Statistics Department is revising the
coverage and estimation procedures used in the quarterly Labour
Force Survey to yield more accurate estimates of unemployment
obtained from the survey. This revision will align the survey
methodology with that used in the General Household Survey, 2005
conducted by the Department of Statistics so that the data obtained
from both surveys are more comparable.
2 As the Labour Force Survey is conducted on a representative sample
of households in Singapore, its coverage excludes construction
workers living on site and workers commuting from abroad to work in
Singapore. To achieve full coverage of the total labour force in
Singapore, the new methodology combines data on residents (comprises
Singapoeans and Singapore Permanent Residents) obtained from the
survey with foreign workforce data compiled from work passes issued
by the Ministry of Manpower.
3 Being a sample survey, data obtained from the Labour Force Survey
are grossed up to the population aggregates by using appropriate
expansion factor(s). The estimation procedures of the survey will be
improved by using multiple expansion factors of gender and
residential status to gross up the data rather than a single
expansion factor used currently.
4 These changes will enable the Labour Force Survey to yield more
accurate estimates of unemployment. It will also enhance
comparability of data with those obtained from the General Household
Survey, 2005 conducted by the Department of Statistics.
5 By applying the new methodology to survey data obtained in
previous years, the unemployment data from March 1992 onwards have
been revised. The overall and resident unemployment rates before and
after the revision are provided in Tables 1 and 2 and charted below.
The revision has the effect of reducing the overall unemployment
rate as the denominator i.e. total labour force is now larger,
taking into account full coverage of the foreign workforce. However,
the trend movement over time remains broadly the same. The impact of
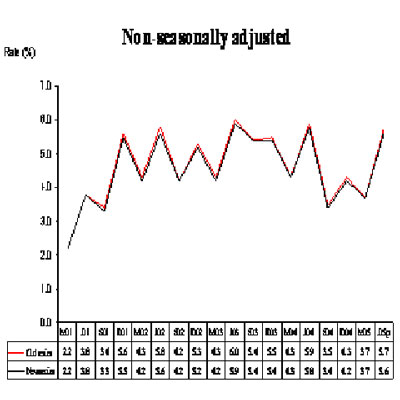
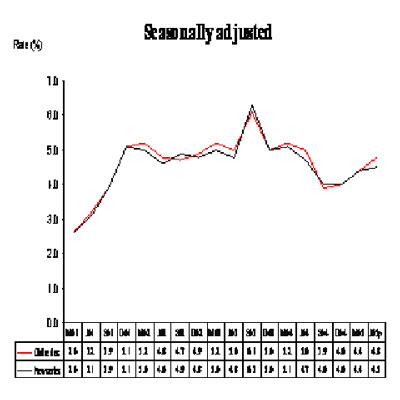
the revision on the resident unemployment rate series is minimal.
CHART 1: OVERALL UNEMPLOYMENT RATE
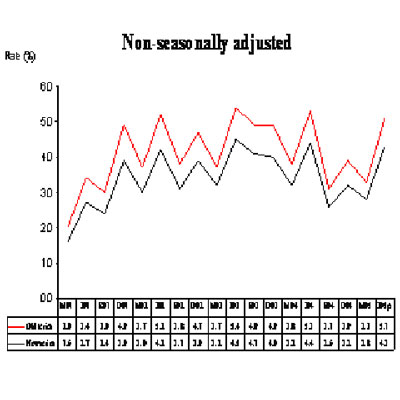
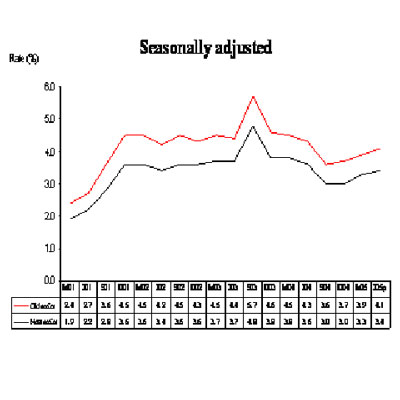
CHART 2: RESIDENT UNEMPLOYMENT RATE
��
��
Source: www.mom.gov.sg Press Release 8 Aug
2005